
Platform series: rebuilding observability so any engineer can debug a failing request

An experienced engineer at TechWolf could spend 15-30 minutes investigating a failing request and still only have a hypothesis. Engineers newer to the system often struggled to know where to start. We had logs and metrics, but no reliable way to follow a request across services.
We rebuilt our observability setup so any engineer could find a request, follow its execution and inspect the relevant context in one place. This post covers the choices that helped, the approaches that didn't work for us, and what we discovered once we could follow requests through the system.
Where our monitoring fell short
Our old observability setup consisted of default Gunicorn access logs in CloudWatch and Django metrics in Prometheus. Neither gave us the ability to follow a specific request as it propagated through the system. Even an experienced engineer would often spend 15-30 minutes aligning charts and logs only to come up with a hypothesis of what might have happened.
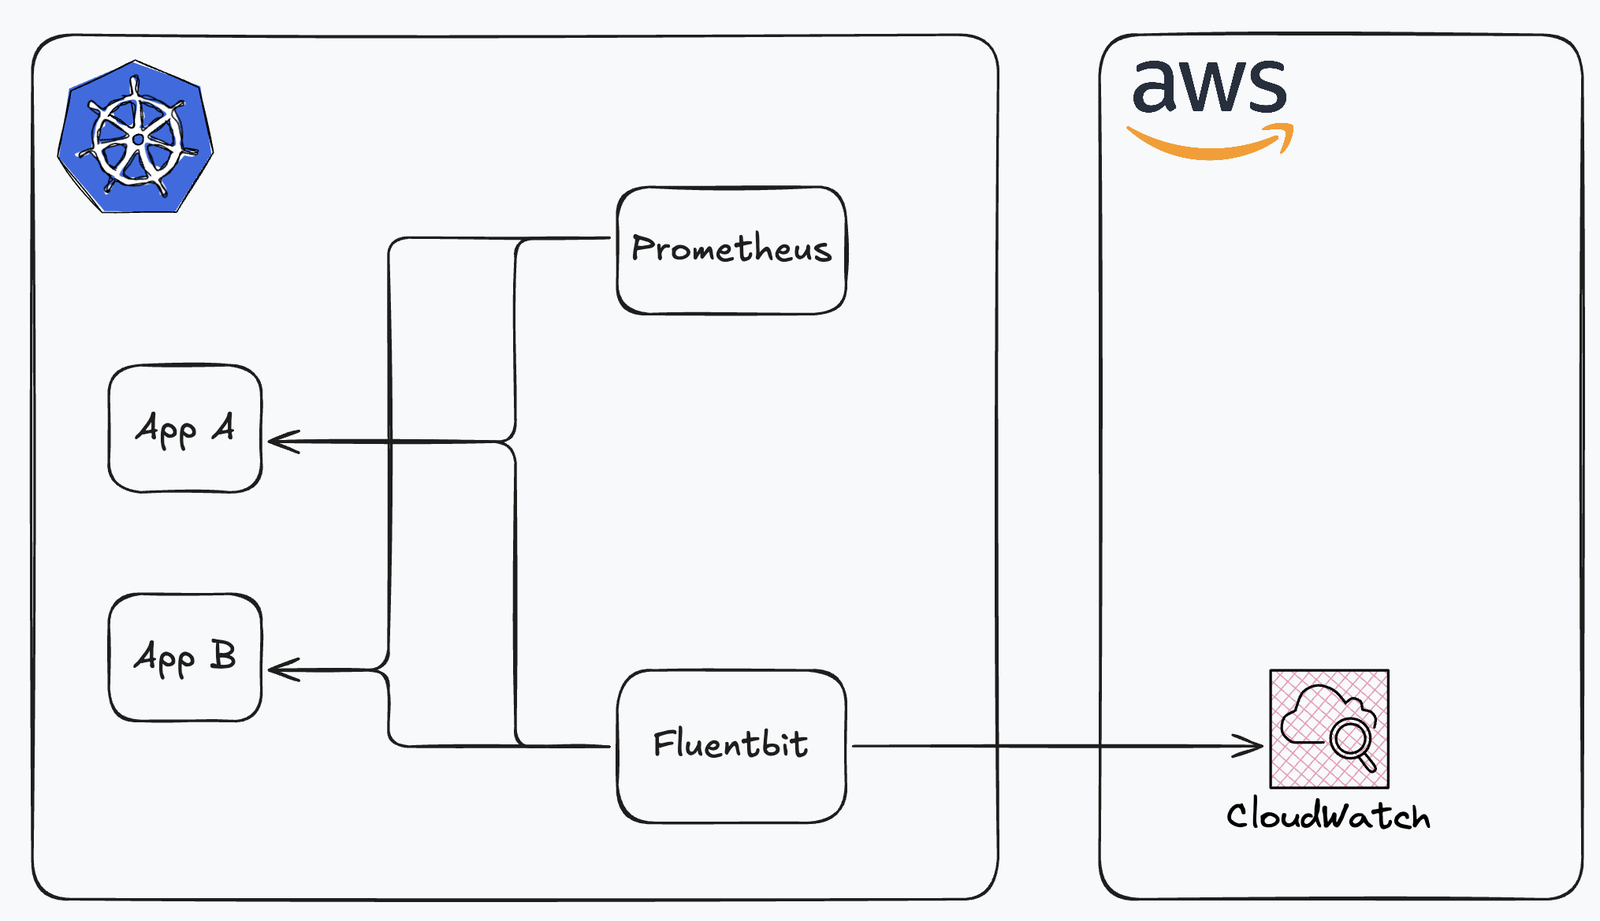
That worked well enough with five engineers. With more than forty engineers, a growing collection of services, and deeper integrations with external systems, investigations increasingly depended on a few people who had the Fingerspitzengefühl to know where the problem might be. Newer engineers did not yet have this experience, and those experienced engineers became a bottleneck. Enterprise customers also brought stricter availability requirements. Unexplained 502 and 503 responses were undermining the API-first product we wanted to offer.
We could see that requests were failing, but we often couldn't explain why a specific request had failed.
From access logs to request context
The hardest issues are the ones you didn't anticipate: why are queries failing only for one tenant, in one region, on one node?
Answering that question requires context about individual requests. Our aggregate metrics could show an increase in failures, but our logs lacked the detail needed to explain which requests were affected and what they had in common.
The first change we made was to move from minimal access logs to wide events: structured request summaries containing both technical and business context. Compare a default Gunicorn access log with an enriched request event:
# Default Gunicorn access log
10.0.4.21 - - [07/Aug/2026:15:55:12 +0200] "POST /api/events HTTP/1.1" 201 128 "-" "python-httpx/0.28.1"
# Enriched
{
  "timestamp": "2026-08-07T13:55:12.043Z",
  "http.request.method": "POST",
  "http.route": "/api/events",
  "http.response.status_code": 201,
  "duration_ms": 43,

  // Business context: which requests are affected?
  "tenant.id": "acme",
  "event.type": "employee.updated",
  // Also: tenant tier, payload size, batch size, webhook ID...

  // Runtime context: what do the affected requests share?
  "service.name": "echo-api",
  "service.version": "2026.08.07",
  // Also: region, pod, node, feature flags, configuration version...

  // Execution context: what happened while handling the request?
  "delivery.attempt": 2,
  // Also: queue wait time, cache hit/miss, downstream status,
  // database query count, time spent on external calls...

  // Correlation: follow the work across services.
  "trace_id": "7f3a9c2e1b6d4f80a5c3e9b71d2f4a68",
  "span_id": "3d8f1a92b4c7e605"
}
The enriched event lets us filter on a specific tenant, event, webhook, deployment or pod and find what the failures have in common. We can investigate all those combinations after an incident has happened, without first updating the code and waiting for it to happen again.
Metrics remained useful for dashboards, alerts and trends. Traces connect the disjoint information of a request as it flows through our services. A trace consists of multiple spans, each describing a unit of work, like a database query, an HTTP request, or a certain section of code.
What makes traces so great is that you actually get a view on how each request goes through your systems. It allowed us to narrow down the cause of a slow p95 on some endpoints in our main API. By comparing time spent across services, we found that most of the slowness was caused by outliers in a downstream service. Optimizing the main API would have missed the problem.
Standardizing instrumentation with OpenTelemetry
We quickly knew we wanted to choose OpenTelemetry to keep our instrumentation independent of our observability backend. In general, we try to use technology that keeps our options open, and allows easy experimentation through self-hosting. Its vendor-neutral APIs and SDKs let us instrument services knowing we won't need to modify them when switching vendors.
Auto-instrumentation gave us traces across HTTP requests and database queries with very little code. By default, though, OpenTelemetry's Python instrumentation enables telemetry for every supported package it detects, which was far more than we needed. We also integrated Sentry with OpenTelemetry, such that engineers can go directly from an error to the corresponding trace. For asynchronous processing, we needed manual instrumentation to propagate trace context across queues to keep producer and consumer in the same trace.
Getting OpenTelemetry set up can be frustrating. Your application could run normally, but telemetry would not show up, with little indication of what's going wrong. For example, we encountered some issues with Gunicorn, where you need to add the OpenTelemetry setup in the post_fork hook. Otherwise the worker processes may not have a functioning telemetry exporter.
We deliberately kept the barrier to adoption low. Since most of our services run on Kubernetes, the OpenTelemetry collector was able to automatically ingest all the application logs. Only tracing required additional instrumentation.
Starting with the services where investigations were most painful let us show value quickly and expand from there. OpenTelemetry handled all the instrumentation and collection, but we still needed a place to store and query the data.
Choosing the backend
We needed engineers to easily find a failing request, and see all its trace context and associated logs. Our cloud provider's observability solutions were an obvious starting point, with the added advantage that they integrate well with cloud-native services that were harder to instrument ourselves. However, the interface left a lot to be desired and navigating between logs, traces and metrics was cumbersome.
We also tried the LGTM stack from Grafana Labs: Loki for logs, Grafana for the experience layer, Tempo for traces and Mimir for metrics. It worked well, and the integration with Grafana was great. Operating and configuring the stack proved to be another beast, which we were not willing to take on, especially since it uses a separate storage backend for each data type.
At TechWolf, we were already running a ClickHouse cluster for our production real-time analytics workloads. That made it a pragmatic storage layer to evaluate. We could insert telemetry from the OpenTelemetry collector directly into ClickHouse, query high-cardinality events with SQL, and reuse infrastructure we already knew how to operate. ClickHouse was also already being used for large-scale event and observability data elsewhere: Sentry uses it as the storage layer behind much of its event querying, while PostHog uses it for analytics and has built OpenTelemetry-based log ingestion on top of it.
We did not move everything. Prometheus remained great at storing infrastructure metrics and Grafana remained useful for dashboards. We moved logs to ClickHouse, added traces, and kept the parts of the old stack that worked well.
HyperDX as the experience layer
Storing the data is only useful if engineers can find and navigate it easily. We wanted an investigation to start with a request, without requiring someone to know which queries or dashboards to open.
We tested SigNoz, Dash0 and others. HyperDX worked best for us. The UI exposed ClickHouse in the right ways: a simple search for common investigations, the ability to move between logs and traces, and SQL available for questions beyond the standard views. It was powerful, without being overwhelming to get started with.
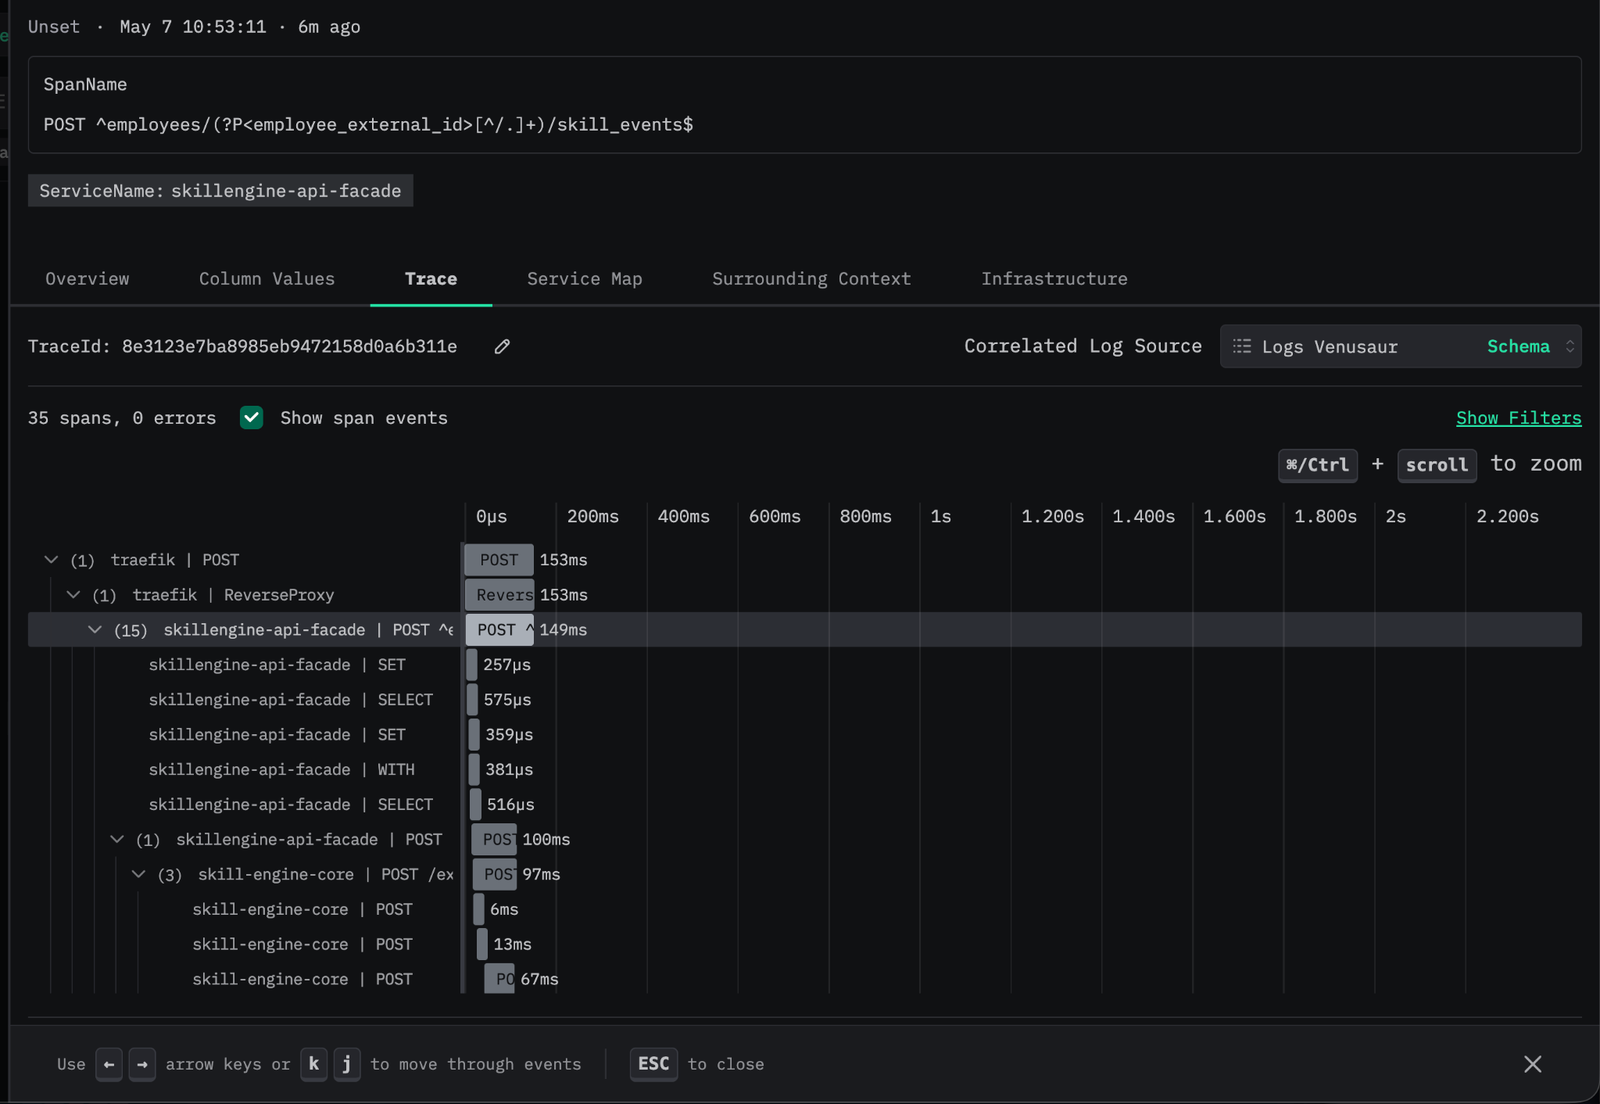
We were not the only ones believing in the UX of HyperDX. Shortly after we committed to using HyperDX, ClickHouse acquired HyperDX in March 2025, and the combination became their open-source observability offering, ClickStack.
Even before services were fully instrumented with traces, engineers started asking whether they could use HyperDX to query their existing logs. The easier access to logs was enough to make them want to switch.
The observability architecture we run today
Our applications emit traces over gRPC to the OpenTelemetry collector, and write structured logs to stdout. A collector runs as a DaemonSet on every Kubernetes node, receiving application telemetry and collecting pod logs. These collectors forward the data to a central OpenTelemetry Collector service for batching, transformation and routing.
The node-level collectors give us access to pod logs. Initially, they sent telemetry directly to ClickHouse, but the volume of small inserts overloaded our shared cluster. This slowed production workloads and caused some telemetry records to be dropped. We added a central collector layer to combine telemetry from across the cluster into larger batches before inserting it into ClickHouse.
Collecting logs from stdout makes adoption easy, but a trace ID in a JSON field does not automatically link the log to its trace. Applications include it in a standardized field, which the collector maps to OpenTelemetry's trace context. This lets us correlate logs and traces without requiring every service to adopt an OpenTelemetry logging SDK.
Our setup also simplified our model observability. Previously, services pushed model inference events to a queue, which a separate service consumed for analytics. We were able to fully remove that service, and query the events through the main telemetry store.
Logs and traces go to ClickHouse. HyperDX is the main interface engineers use to search them and follow a request across services. Infrastructure metrics continue to go to Prometheus and are visualized in Grafana.
Across our two production regions, we ingest roughly 149 million telemetry records per day across 34 services. At the time of writing, ClickHouse held 24.8 billion log and trace records. Their 29.3 TB of uncompressed column data occupied 1.12 TB after compression: roughly 28× compression for traces and 20× for logs.
Most investigations use recent telemetry, but we wanted older data available when needed. However, this becomes expensive quickly if we keep all data on disk. Now we keep the latest 30 days on disk, then move it to S3 using a ClickHouse TTL rule. Older data remains queryable seamlessly, just with higher query latency and lower storage costs.
TTL Timestamp + INTERVAL 30 DAY TO VOLUME 's3'
We kept Prometheus for infrastructure metrics. Our metrics were still relatively low-cardinality, so moving them to ClickHouse offered less obvious value. It would also mean replacing established queries and alerting, and giving up some of the extensive Prometheus ecosystem we relied on. ClickHouse is actively developing its time-series and PromQL capabilities, but for us, logs and traces were where the migration brought the clearest benefit.
What application monitoring missed
Our old monitoring mostly observed requests that reached Django. Requests rejected before reaching the application were missing from that view, so our application-level error rate could look healthy while customers were receiving errors.
We instrumented Traefik, the edge of our system, and compared the traces with Django's. During one week in one production region, Traefik handled 13.7 million requests and returned 10,390 5xx responses in total. Django saw only 4,570 of those failures.
This left 56 percent of the customer-facing failures invisible to our application-level monitoring. A deeper dive into Traefik's own metrics might eventually have surfaced the same gap, but having traces and logs from every hop in one place is what made it obvious immediately, instead of requiring someone to go looking for it.
Additionally, it exposed significant time spent waiting in Gunicorn queues before Django began handling the request, another part that application-level instrumentation missed.
Conclusion
OpenTelemetry gave us consistent instrumentation, ClickHouse let us store and query the request context, and HyperDX made it easy to explore. We kept Prometheus and Grafana where they already worked well.
An engineer should be able to investigate a failing request without first asking someone who has worked on the service for years. Debugging still takes experience, but finding the relevant evidence should not depend on having seen the same issue before.
Read the full blogpost on Medium
Blog
From guides to whitepapers, we’ve got everything you need to master job-to-skill profiles.
Platform series: rebuilding observability so any engineer can debug a failing request
Real-time analytics, 1000× faster: our journey from Postgres to ClickHouse
Meet LAIQA: our first step towards an event-driven architecture
